Patent Landscape Analysis: From Scope to Whitespace
A patent landscape analysis maps the patents in a technology area to answer strategic questions. Who are the major players? Where are they filing? Which sub-domains are crowded, and where is the whitespace?
Unlike a prior art search, which asks whether a specific invention is novel, a landscape analysis takes a bird’s-eye view. It is the difference between checking whether one house exists on a block and mapping the whole neighborhood. And unlike a freedom-to-operate analysis, which asks whether your product would infringe another party’s claims, a landscape view stays at the portfolio level.
What a landscape analysis produces
A useful landscape report combines four kinds of evidence:
- Filing trends: how many patents are being filed per year, and whether the field is growing, plateauing, or declining.
- Top assignees: which companies, universities, or research institutions hold the most patents, and how that share is shifting.
- Technology clusters: which sub-domains within the field are densely patented, and which are thin.
- Geographic distribution: where filers are seeking protection. US-only? Europe? China?
The value is rarely in any single data point. It is in the picture that emerges when you overlay them.
When to do a landscape analysis
Before entering a new technology area
If your company is expanding into autonomous vehicles, gene therapy, or solid-state batteries, a landscape tells you what you are walking into. How many patents exist? Who dominates? Are there sub-areas with fewer patents where you could carve out a position? This is basic due diligence before committing R&D budget.
Evaluating acquisition targets
In M&A, the target’s patent portfolio is a significant asset, and a thin or poorly aligned portfolio is itself a red flag. A landscape reveals how the target compares to competitors, whether its patents cover growing or declining technology areas, and whether there are gaps that create risk.
Identifying licensing opportunities
If you need to license technology, a landscape shows you who owns what. It reveals whether a single company controls a critical area or whether the IP is fragmented across many holders, which directly affects negotiation leverage.
Informing R&D portfolio decisions
R&D teams use landscape data to avoid investing in saturated areas and to identify emerging fields where early patents could provide an advantage. If 80% of the patents in your target area come from three companies, the barrier is high. If filings are sparse, the opportunity may be open. Or the area may simply not be commercially viable yet.
Step-by-step process
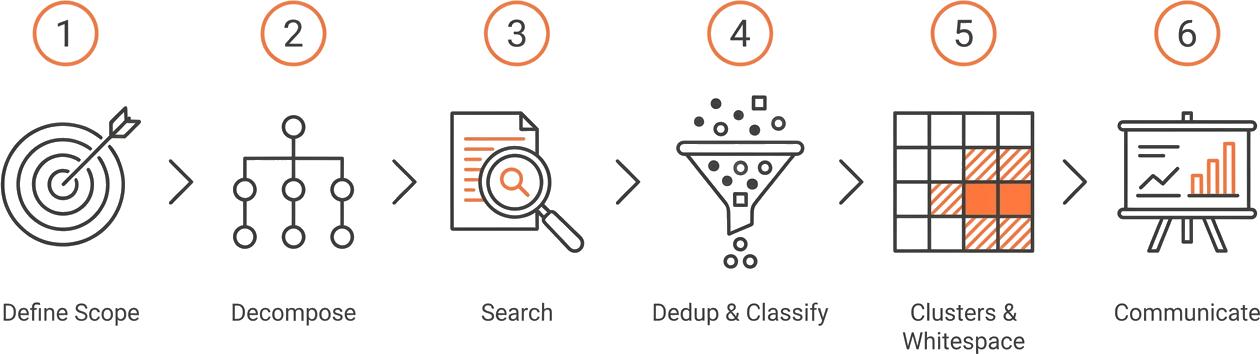
The classical landscape workflow has six stages. The first two and the last one still belong to a human. The three in the middle are where AI tooling, including GoVeda’s Landscape Report, replaces weeks of manual work.
Step 1. Define the technology scope and questions
Start by articulating what you want to learn. “Map all patents related to lithium-ion battery thermal management” is a scope statement. “Who are the top five filers, and which sub-technologies do they focus on?” is a research question.
Be specific enough to get actionable results, broad enough to capture the full field. Too narrow and you miss the context. Too broad and the data becomes noise. Time spent here saves rework downstream.
This step is human work, and should remain so. The framing is a business decision.
Step 2. Decompose the scope into searchable scenarios
A single technology area almost always contains multiple sub-problems. “Battery thermal management” includes liquid cooling, phase-change materials, cell-level sensors, pack-level control, and more. Treating them as one query produces a blurry picture; running them as separate searches and then re-aggregating produces a sharp one.
This is where landscape work historically broke down. Analysts either flattened everything into one query, or hand-curated dozens of sub-queries. GoVeda’s Landscape Report performs this decomposition automatically: its first stage splits a free-text product or technology description into discrete scenarios, then runs each as its own retrieval pass.
Step 3. Run the search across each scenario
For each scenario, you need recall before you need precision. Use a combination of search strategies:
- Semantic search to cast a wide net using natural-language descriptions.
- Keyword search with Boolean operators for specific terminology.
- Classification codes (CPC/IPC) to ensure structural coverage of the domain.
GoVeda runs semantic retrieval across 220M+ patent publications in 108 jurisdictions. Filters for assignee, classification, date range, jurisdiction, and language let you scope the result set without writing query DSL by hand. For assignee-centric questions (“what does Toyota hold in this space?”), the party search view lets you pull a filer’s filings directly.
Step 4. Deduplicate and classify
Raw search results carry noise. The same invention shows up multiple times because it has been filed in several jurisdictions. Those duplicates are members of one patent family (in the simple, common-priority sense), not independent data points. Terminology overlap also drags in patents that match your query but fall outside the real scope.
Three things have to happen here:
- Family-level deduplication so you count inventions, not filings.
- Relevance filtering to drop near-misses.
- Sub-classification so each remaining patent is tagged by the dimension that matters to your question (sub-technology, application area, business model).
In a manual workflow this is the bottleneck. Tagging a few thousand patents by hand is often days of analyst time. GoVeda’s Landscape Report handles dedup and per-scenario classification as part of its aggregation pass; the analyst’s job shifts to spot-checking edge cases rather than tagging from scratch.
Step 5. Identify clusters, blocking patents, and whitespace
With a clean, classified set, the strategic patterns become readable:
- Clusters: sub-areas with dense filing activity. Entering one means competing against established portfolios.
- Blocking patents: in-force filings whose claims could read on your roadmap. (“Blocking” is the term GoVeda uses for the highest-risk patents identified in its FTO and landscape outputs; in classical IP usage the word can be narrower.)
- Whitespace: sub-areas where filings are sparse despite the technology being feasible. Whitespace can mean opportunity, or it can mean nobody believes there is a market. Judgment is required.
GoVeda’s Landscape Report produces a structured output here rather than a free-form essay. Each scenario gets a blocking tier classification (tier 1 / 2 / 3 by risk), a feature matrix showing which technical features are dominated by which filers, and a whitespace matrix highlighting sparse cells. For product and R&D leadership this is the most actionable artifact: it tells you exactly where the existing IP is concentrated and where it is not.
Cross-reference clusters with assignee data. A cluster dominated by one company is usually a deliberately fortified position, often built up by an incumbent over years. A fragmented cluster means more licensors to negotiate with, and rarely a single chokepoint to capture.
Step 6. Communicate findings
A landscape is only useful if stakeholders act on it. The output should be readable by people who do not work with patents day-to-day. GoVeda’s Landscape Report produces a multi-chapter narrative (executive summary, scenario-by-scenario analysis, recurring patents, conclusions) designed to be read top-to-bottom by a non-specialist.
What it does not include is presentation graphics: filing-trend line charts, geographic heatmaps, bubble charts. Those still belong in your slide deck, built from the underlying data once you know which view tells the story. The aggregation work is done; the visualization is yours.
What GoVeda automates, and what it doesn’t
A useful way to set expectations:
| Step | Automated by GoVeda Landscape Report | Still your job |
|---|---|---|
| 1. Scope definition | — | Frame the question, set boundaries |
| 2. Scenario decomposition | Yes, splits free-text input into scenarios | Sanity-check the split |
| 3. Search execution | Yes, semantic retrieval across 220M patents | — |
| 4. Dedup & classification | Yes, family dedup + per-scenario tagging | Spot-check edge cases |
| 5. Clusters & whitespace | Yes, blocking tiers, feature matrix, whitespace matrix | Decide which gaps are commercially viable |
| 6. Communication | Yes, multi-chapter narrative report | Charts, slides, the “so what” |
GoVeda removes the mechanical work: retrieval, dedup, classification, aggregation, narrative drafting. It does not replace the strategic judgment about what to investigate or what the findings mean for your business.
Getting started
If you have a product or technology area in mind, the fastest path is to describe it in plain language and let the Landscape Report run end-to-end. Iterate on the scope after the first pass: the report’s scenario breakdown often surfaces sub-areas you had not isolated, which sharpens the next run.
GoVeda’s Landscape Report is currently in Beta. Get started at goveda.com by selecting Landscape mode.
Disclaimer: This article is provided for general information only and does not constitute legal advice. A landscape analysis informs strategic decisions but does not substitute for a legal opinion. Consult qualified patent counsel before relying on it for licensing, M&A, or freedom-to-operate decisions.